Financial Highlights(consolidated)
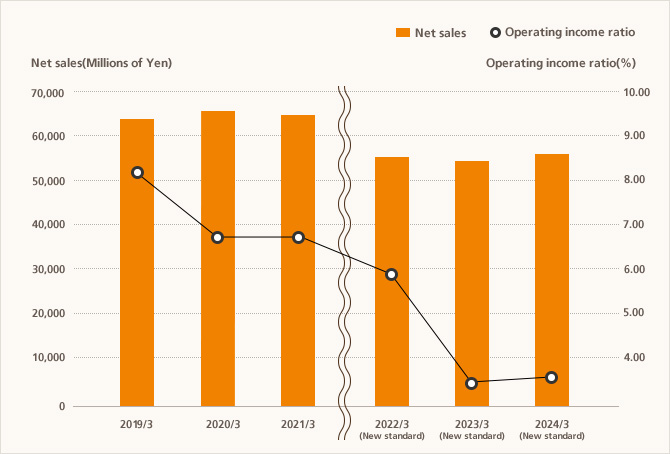
| 2021/3 (Old standard) |
2022/3 | 2023/3 | 2024/3 | 2025/3 | 2026/3 | |
| Net sales | 64,204 | 55,074 | 53,915 | 55,715 | 57,077 | 55,534 |
| Cost of sales | 37,891 | 36,935 | 38,185 | 39,271 | 40,591 | 39,749 |
| SG & A expenses |
21,995 | 14,986 | 14,480 | 14,913 | 15,355 | 14,318 |
| Operating income |
4,317 | 3,152 | 1,249 | 1,530 | 1,131 | 1,466 |
| Ordinary income |
4,711 | 3,506 | 1,558 | 1,881 | 1,554 | 1,900 |
| Net income attributable to shareholders of parent |
3,405 | 2,115 | 1,406 | 1,110 | 951 | 1,428 |
(Millions of Yen)
(Note) (Old standard) is sales before applying the revenue recognition standard.
Net Sales by Category(consolidated)
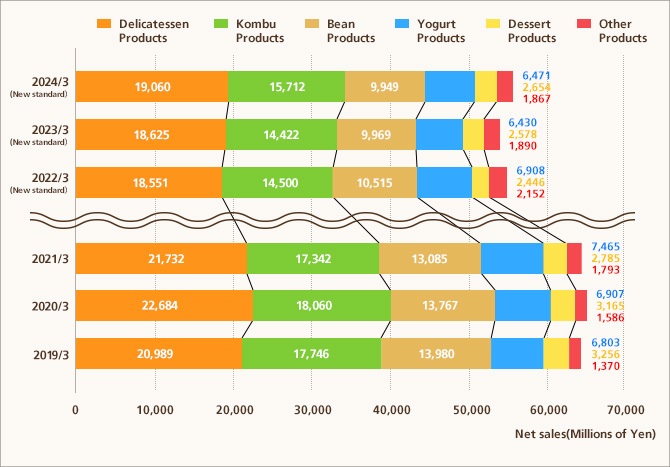
| 2021/3 (Old standard) |
2022/3 | 2023/3 | 2024/3 | 2025/3 | 2026/3 | |
| Delicatessen Products |
21,732 | 18,551 | 18,625 | 19,060 | 19,064 | 17,655 |
| Kombu Products |
17,342 | 14,500 | 14,422 | 15,712 | 15,917 | 16,348 |
| Bean Products |
13,085 | 10,515 | 9,969 | 9,949 | 10,483 | 10,146 |
| Yogurt Products |
7,465 | 6,908 | 6,430 | 6,471 | 6,759 | 7,081 |
| Dessert Products |
2,785 | 2,446 | 2,578 | 2,654 | 2,715 | 2,166 |
| Other Products |
1,793 | 2,152 | 1,890 | 1,867 | 2,138 | 2,135 |
| Total | 64,204 | 55,074 | 53,915 | 55,715 | 57,077 | 55,534 |
(Millions of Yen)
(Note) (Old standard) is sales before applying the revenue recognition standard.
Cost of Sales Ratio・Selling,
General and Administrative Ratio(consolidated)
| 2021/3 (Old standard) |
2022/3 | 2023/3 | 2024/3 | 2025/3 | 2026/3 | |
| Cost of sales ratio |
59.0 | 67.1 | 70.8 | 70.5 | 71.1 | 71.6 |
| SG & A ratio | 34.3 | 27.2 | 26.9 | 26.8 | 26.9 | 25.8 |
(%)
(Note) (Old standard) is calculated from sales before applying the revenue recognition standard.
Representative Figures of Selling,
General and Administrative Expenses(consolidated)
| 2021/3 (Old standard) |
2022/3 | 2023/3 | 2024/3 | 2025/3 | 2026/3 | |
| Advertising expenses |
2,051 | 2,085 | 1,927 | 1,967 | 2,076 | 1,531 |
| Packing and freight expenses |
3,468 | 3,293 | 3,230 | 3,262 | 3,457 | 3,264 |
| Sales promotion expenses |
7,409 | 711 | 695 | 711 | 679 | 761 |
| Personnel expenses |
4,129 | 3,918 | 3,762 | 4,009 | 4,007 | 3,798 |
(Millions of Yen)
(Note) (Old standard) is before applying the revenue recognition standard.
Cash Flows(consolidated)
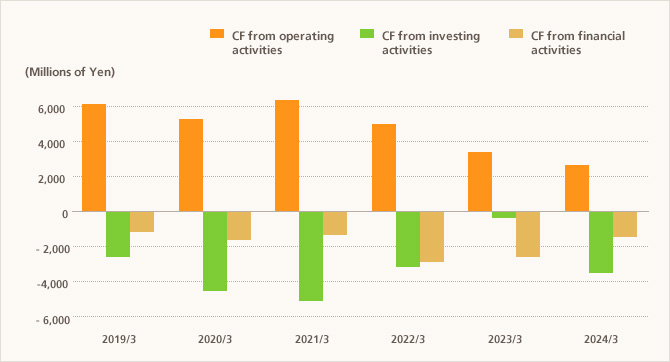
| 2021/3 | 2022/3 | 2023/3 | 2024/3 | 2025/3 | 2026/3 | |
| CF from operating activities |
6,105 | 5,101 | 3,331 | 2,800 | 4,485 | 1,650 |
| CF from investing activities |
- 5,604 | - 3,330 | - 168 | - 3,423 | - 2,819 | - 3,811 |
| CF from financial activities |
- 1,233 | - 2,867 | - 2,666 | - 1,311 | - 1,313 | - 283 |
| Cash and cash equivalents at the end of period |
13,874 | 12,778 | 13,275 | 11,340 | 11,692 | 9,249 |
(Millions of Yen)
Capital Investment(consolidated)
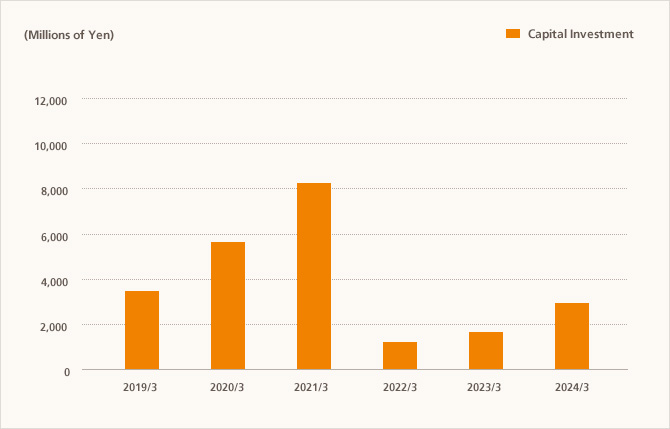
| 2021/3 | 2022/3 | 2023/3 | 2024/3 | 2025/3 | 2026/3 | |
| Capital Investment |
8,232 | 1,605 | 1,808 | 2,713 | 2,849 | 2,936 |
(Millions of Yen)
Depreciation and Amortization(consolidated)
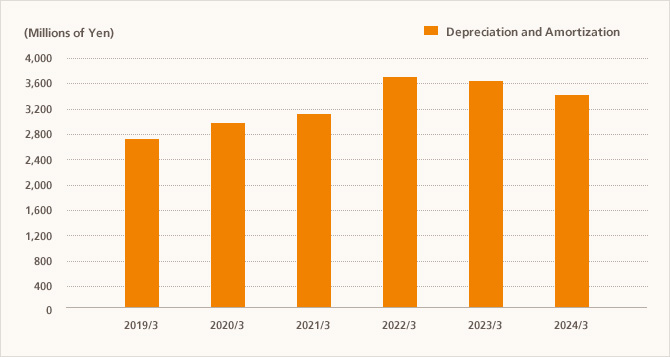
| 2021/3 | 2022/3 | 2023/3 | 2024/3 | 2025/3 | 2026/3 | |
| Depreciation and Amortization |
3,176 | 3,698 | 3,639 | 3,414 | 3,477 | 3,512 |
(Millions of Yen)
Research and Development(consolidated)
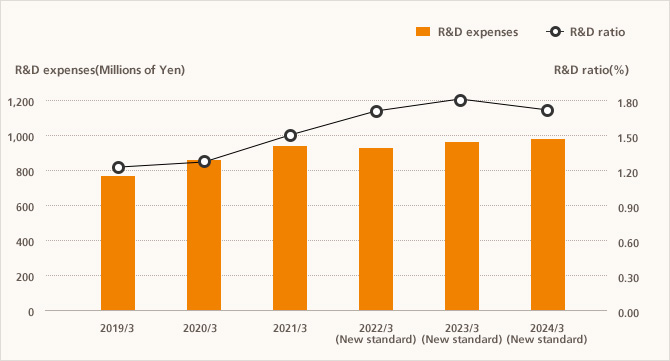
| 2021/3 (Old standard) |
2022/3 | 2023/3 | 2024/3 | 2025/3 | 2026/3 | |
| R & D expenses |
965 | 962 | 973 | 983 | 1,010 | 949 |
| R & D ratio(%) |
1.50 | 1.78 | 1.75 | 1.72 | 1.77 | 1.71 |
(Millions of Yen)
(Note) (Old standard) is calculated from sales before applying the revenue recognition standard.
Management Indicators(consolidated)
| 2021/3 | 2022/3 | 2023/3 | 2024/3 | 2025/3 | 2026/3 | |
| Shareholder's equity ratio(%) |
83.2 | 86.9 | 86.9 | 85.8 | 86.4 | 86.9 |
| Return on equity(%) |
4.9 | 3.0 | 2.0 | 1.6 | 1.4 | 2.1 |
| Ratio of ordinary income to total assets(%) |
5.7 | 4.2 | 2.0 | 2.4 | 1.9 | 2.4 |
| Earnings per share(yen) |
113.70 | 71.03 | 49.09 | 39.00 | 33.44 | 50.18 |
| Net assets per share(yen) |
2,366.94 | 2,389.39 | 2,407.06 | 2,424.75 | 2,409.55 | 2,455.15 |
(Millions of Yen)
※Number of outstanding shares:30,050,759 shares